

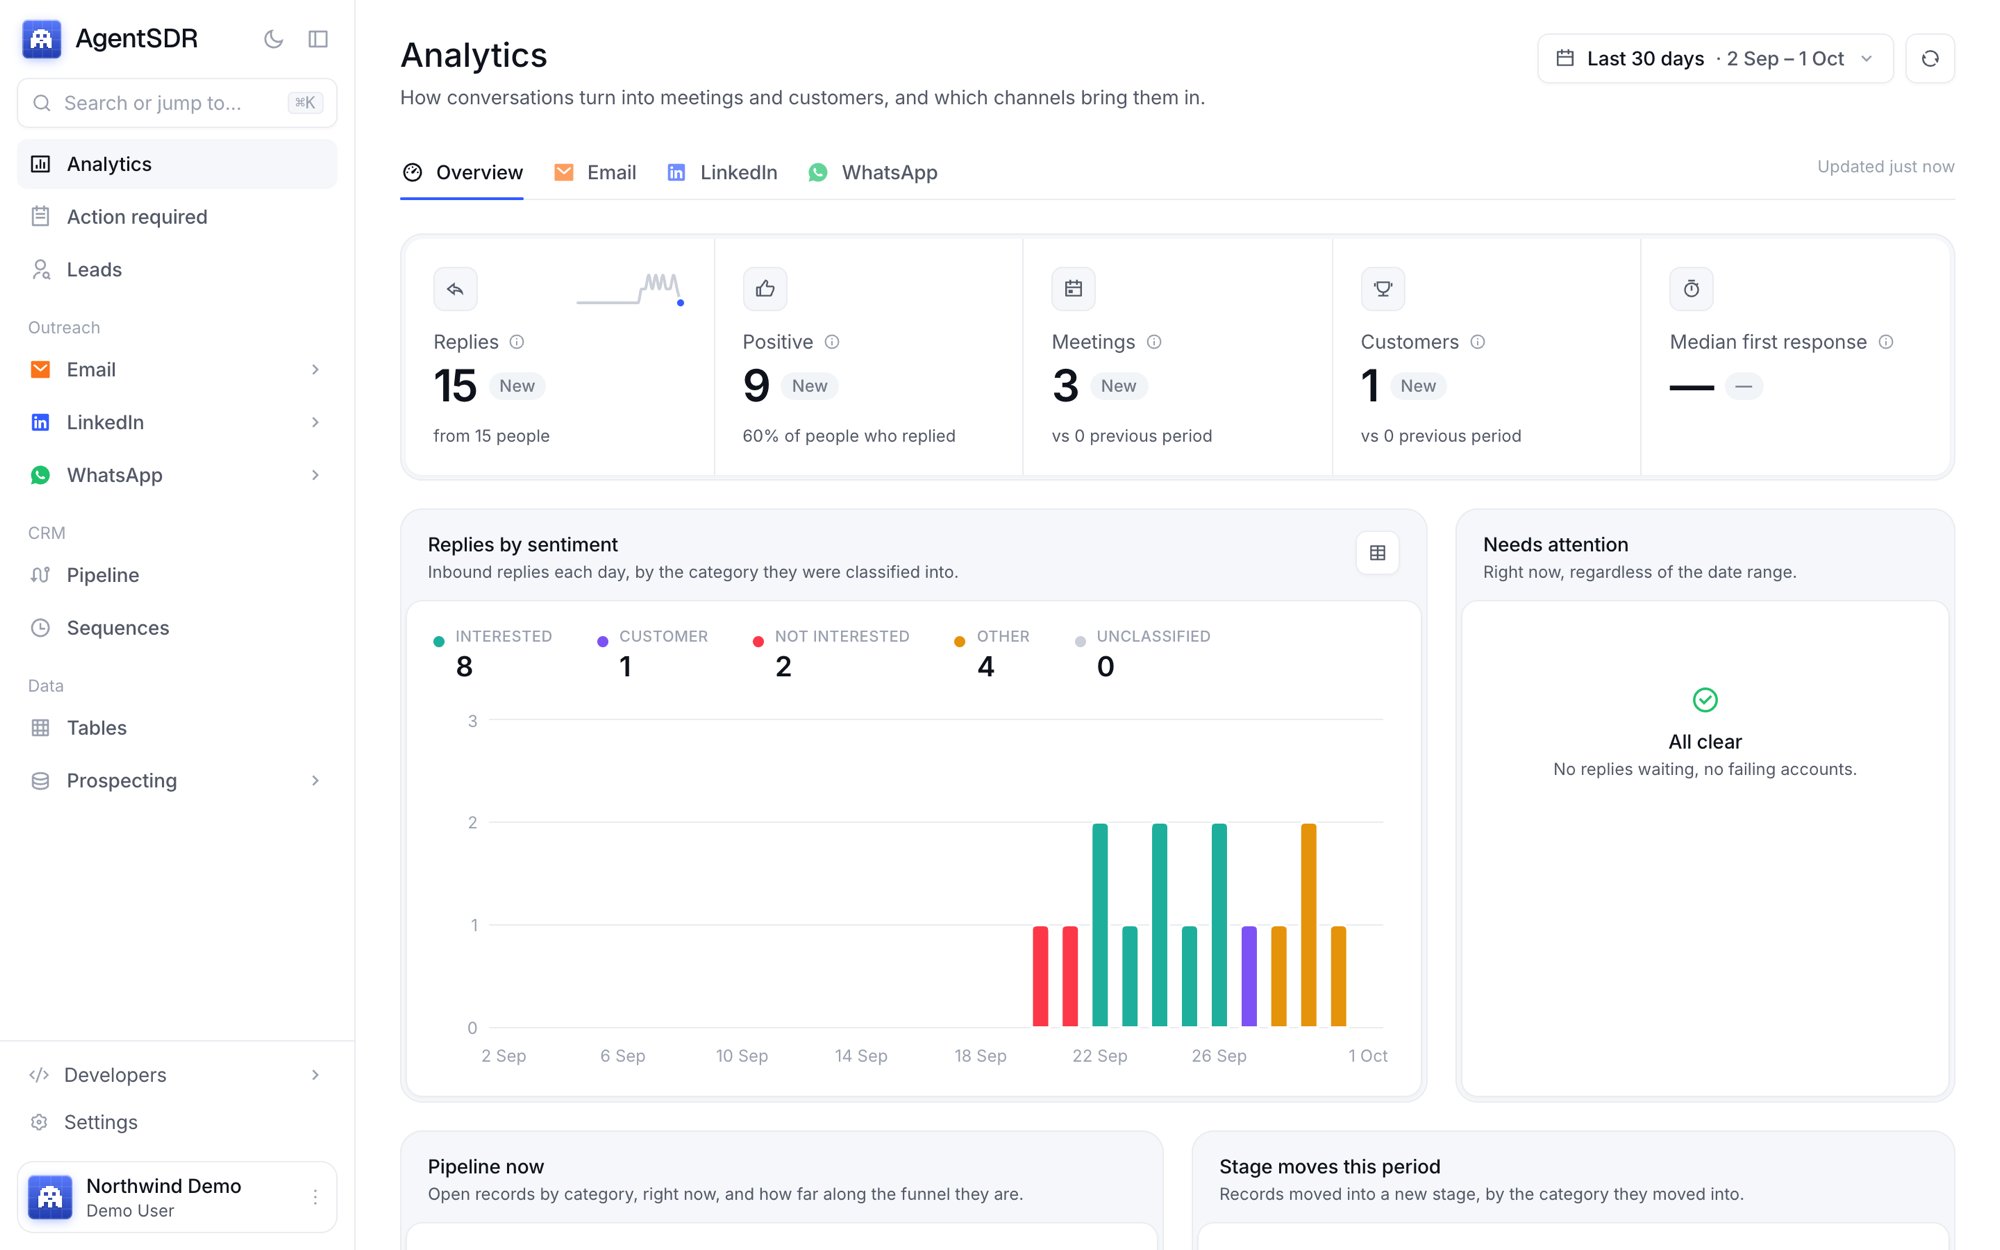
Pick a period
The date control at the top right sets the period for everything below it. Choose Last 7 days, Last 30 days (the default), Last 90 days, This month or Last month, or enter a Custom range with a start and end date and choose Apply range. A custom range can span at most 180 days.- Days are cut in your browser’s time zone.
- Charts show one point a day for ranges up to 62 days, and one point a week for longer ranges.
- The refresh button reloads the numbers, and a label next to the tabs shows how long ago they loaded.
- The page remembers the view and period in its address, so you can bookmark or share a link to it.
Compare with the previous period
Most figures carry a change badge. It compares the period you picked with the period of the same length that ends the day before it starts. If you pick 30 days, the comparison is the 30 days before those. A grey New badge means there was nothing in the previous period. A dash means there is no previous data to compare. Green means better and red means worse, and for figures where lower is better, such as median first response, bounces or the AI override rate, a decrease is shown as an improvement.Overview
The Overview tab starts with the conversations in your CRM and then shows where they came from.
Positive, Meetings and Customers count records that moved into the stage during the period, so a record that was already there before the period is not counted again. Below the figures:
- Replies by sentiment stacks inbound replies per day or week by the category they were classified into: Interested, Customer, Not interested, Other and Unclassified.
- Needs attention is described below.
- Pipeline now shows open records by category, and how far along the funnel they are.
- Stage moves this period shows records that moved into a new stage, with the top stages.
- Workflow shows every record by its current workflow state, such as Action required, Waiting, Paused, Error or Closed.
- AI assistant shows drafts generated in the period, how many were sent, drafts sent, replies classified and the override rate: the share of labels a person changed. It also shows how many sent drafts went out unedited, edited or were discarded.
Channels and funnel
Under Outreach, the Channels table compares Email, LinkedIn and WhatsApp by people Reached, Replied, Reply rate and Positive. Select a row to open that channel’s tab. Reached counts distinct people with any outbound touch in the period: an email, a LinkedIn invitation or message, a WhatsApp call or an outbound WhatsApp message. The Conversion funnel runs from Reached to Replied, Positive, Meeting and Customer. Its counts are for the period. They are not one group of people followed from first touch to customer, so a later stage can include people you reached before the period began.Needs attention
Needs attention lists what is open right now, with a count for each and a link to where you can fix it:- Action required, conversations waiting on you, opens the queue.
- Follow-ups due, follow-ups drafted or past their time.
- Drafts to review, AI replies waiting for approval.
- Failing mailboxes, email accounts that cannot send, opens Settings, Mailboxes.
- LinkedIn disconnected, accounts that need reconnecting.
- WhatsApp disconnected, numbers that need relinking.
Channel tabs
Each channel has its own tab with a figure strip, a chart and per-campaign detail.Email
Emails sent (first touches and follow-ups), Leads contacted (distinct leads sent a first email), Replied (distinct people who sent an inbound email reply), Reply rate (replied divided by leads contacted), Bounced and Unsubscribed (addresses added to the suppression list in the period).Opens and clicks are not recorded, so there are no open or click rates. Mailbox capacity today shows what each mailbox has sent against its daily limit, and Campaigns lists sends for the period alongside all-time leads, replies and bounces.
LinkedIn
Invites sent, Accepted (counted when the accept is recorded, which can be for an earlier invite), Acceptance rate (accepted divided by invites sent), Messages sent (after a connection), Replied and Reply rate. LinkedIn reply rate divides by accepted connections, not by invites sent.Accounts and Daily invite capacity show connection state and today’s invitations against each account’s limit.
WhatsApp
Calls covers Calls placed, Connected, Connect rate, Talk time and Avg call, with Call outcomes: Connected, Did not pick up, Not on WhatsApp, Failed and In progress. Calls counted are those placed from AgentSDR.Messages covers Messages sent (sent by AgentSDR or typed on the phone or WhatsApp Web), Messages received, Chat reply rate (of chats you wrote in during the period, the share that got a later reply) and New chats (started from AgentSDR).
Related
Action required
Work the queue that Needs attention points to.
Pipeline
Open leads by where they stand.
Email campaigns
The campaigns behind the email tab.
Sending rules
The limits behind the capacity meters.